
FREQUENCIES AND TIMES OF POSSESSION IN OFFENSIVE AND DEFENSIVE PHASES ACCORDING TO CLASSIFICATION IN MALE HIGH LEVEL WATER POLO
FRECUENCIAS Y TIEMPOS DE POSESIÓN EN FASES OFENSIVAS Y DEFENSIVAS SEGÚN LA CLASIFICACIÓN EN WATERPOLO MASCULINO DE ALTO NIVEL


Francisco Manuel Argudo-Iturriaga, Pablo García-Marín
FREQUENCIES AND TIMES OF POSSESSION IN OFFENSIVE AND DEFENSIVE PHASES ACCORDING TO CLASSIFICATION IN MALE HIGH LEVEL WATER POLO
Cultura, Ciencia y Deporte, vol. 20, no. 66, 2025, 10.12800/ccd.v20i66.2350
Universidad Católica San Antonio de Murcia
Francisco Manuel Argudo-Iturriaga
Universitat de Valencia, España
Pablo García-Marín a
Universidade de Santiago de Compostela, España
Received: 29 April 2025
Accepted: 08 october 2025
Abstract: The aim of the study was to compare the frequencies and times of possession in offensive and defensive phase in water polo as a function of the final classification in the championship. We analyzed 58% of the matches played in seven European and eight World Championships at the highest level (n = 372) over a period of 14 years 2010-2024. The data for the variables analyzed were extracted from the records published on the websites of each championship, categorized into three classification groups: Q1 (top three, medalists); Q2 (sixth, seventh and eighth place finishers); Q3 (bottom three). Consistency was assessed by interobserver reliability with the Intraclass Correlation Index (ICC = .93). It was found that the frequencies of possessions in attack per period were similar for all teams (9.7 ± .04). However, Q1 spent less time per possession in attack(24.5 ± 4.0 s.), while Q3 spent less time per possession (25.5 ± 6.0 s.) and had a higher frequency of defenses (9.7 ± 1.5). The time to score or concede a goal was related to the ranking achieved in the championship. Frequencies and times of possession are useful performance indicators that allow for planning training sessions aimed at competitive performance.
Keywords: Classification, game-related statistics, possessions, performance, team sports.
Resumen: El objetivo del estudio fue comparar las frecuencias y los tiempos de posesión en fase ofensiva y defensiva en waterpolo en función de la clasificación final en el campeonato. Se analizó el 58% de los partidos disputados en siete Campeonatos de Europa y ocho Campeonatos del Mundo al más alto nivel (n = 372) en un periodo de 14 años 2010-2024. Los datos de las variables analizadas se extrajeron de las actas publicadas en las páginas web de cada campeonato, categorizadas en tres grupos de clasificación: Q1 (tres primeros, medallistas); Q2 (sexto, séptimo y octavo clasificados); Q3 (tres últimos). La coherencia se evaluó mediante la fiabilidad interobservador con el índice de correlación intraclase (ICC = .93). Se observó que las frecuencias de las posesiones en ataque por periodo eran similares para todos los equipos (9.7 ± .04). Sin embargo, el Q1 empleó menos tiempo por posesión en ataque (24.5 ± 4.0 s.), mientras que el Q3 empleó menos tiempo por posesión (25.5 ± 6.0 s.) y tuvo una mayor frecuencia de defensas (9.7 ± 1.5). El tiempo para marcar o encajar un gol estaba relacionado con la clasificación lograda en el campeonato. Las frecuencias y los tiempos de posesión son indicadores de rendimiento útiles que permiten planificar sesiones de entrenamiento orientadas al rendimiento competitivo.
Palabras clave: Clasificación, deportes de equipo, estadísticas de juego, posesiones, rendimiento.
Introduction
The analysis of playing action in water polo has been carried out using various research methods and strategies. On the one hand, there are many observational studies aimed at discriminating the technical-tactical indicators associated with performance by means of match analysis (Argudo-Iturriaga et al., 2021; García-Marín & Argudo, 2017a; García-Ordóñez & Touriño-González, 2021; García-Ordóñez & Touriño-González, 2022a; García-Ordóñez et al., 2017; Lupo et al., 2012; Lupo et al., 2014; Ordóñez et al., 2016; Özkol et al., 2013; Platanou, 2004a; Sabio et al., 2020; Tucher et al., 2014; Vila et al., 2011). From this perspective, many of the studies have compared the winners versus losers of the games, focusing especially on the effectiveness of the shots and the game context in which they occur (García-Marín & Argudo, 2017a; García-Ordóñez & Touriño-González, 2022b; Lupo et al., 2014; Platanou, 2004a; Vila et al., 2011). Thus, the situational framework of the shot, the origin and distance of the previous pass, the type of previous reception, the position, type and direction of the shot, the type of defensive block that opposes the shot or the position and stopping technique of the goalkeeper have been investigated.
On the other hand, the knowledge generated by observational studies has been extended thanks to the analysis of technical-tactical performance indicators extracted from match reports using game-related statistics. These statistics, provided by the organizing committees and published on the championships' websites, are used by the coaches themselves and other members of the technical staff to make tactical decisions during the game (Komić et al., 2024). This methodology assumes a small loss in the reliability of the data collected, as it relies, in the first instance, on the scorers appointed by the organizing committees. However, the reduction in the time to extract information and the consequent increase in the amount of data that can be processed entail two advantageous features over the observational methodology.
In water polo, the first studies that used game related statistics were those of Escalante et al. (2011, 2012), who analyzed more than 20 performance indicators in several high-level international championships. These studies introduced variables that had not been studied to date, such as the frequency of assists, offensive fouls, exclusions or loss of possession. Subsequently, Saavedra et al. (2014, 2016) incorporated the margin of victory variable into the comparative analysis of winner-loser, distinguishing between balanced, unbalanced and very unbalanced matches according to the goal difference between the teams. As the rules of water polo evolved, new variables were included, such as the frequency of rebounds or exclusions with substitution after 4 minutes. Consequently, the game-related statistic was used to evaluate the effects of regulatory changes (Madera et al., 2017), incorporating discriminant analysis based on decision trees (Saavedra et al., 2020). Finally, García-Ordóñez and Touriño-González (2022b) extended the analysis to the identification of all-star players by employing individual statistics of each player.
As can be seen, in all the previous works the strategy for identifying performance indicators is based on the winner and loser status of the matches. However, it must be considered that, in international championships, such as the Olympic Games and World Championships, the bottom of the ranking usually has much lower levels of play than the rest of the teams, due to the classification system proposed by the World Aquatics in which countries from the five continents must participate. As a result, results are produced with excessively large margins of victory, especially in the preliminary group phase (García-Marín & Argudo-Iturriaga, 2017b). In this context, when study samples are restricted to a single championship, the winner-loser condition does not favor the identification of performance indicators. One way to minimize this drawback would be to use as a comparison factor the ranking of the championship, where the performance for each team is determined by the results in six or seven matches instead of only one.
To date there are few studies that have used championship ranking as a comparison factor. García-Marín and Argudo-Iturriaga (2017b) distinguished two ranking levels to discriminate performance indicators between medalist and non-medalist teams. Other works evaluated the effects of regulatory changes in European championships using three ranking levels (1- top four ranked; 2-ranked fifth to eighth; 3-ranked ninth to twelfth) in men (Argudo-Iturriaga et al., 2021) and women (Argudo-Iturriaga et al., 2022).
The frequencies and, especially, the times of possessions are variables that have been little studied. Nevertheless, they represent relevant data that should be considered to a) manage loads in training planning together with physiological demands, known from studies based on Time Motion Analysis (D'Auria & Gabbett, 2008; Melchiorri et al., 2020; Platanou, 2004b); b) adjust the effort/rest ratio of players during competition according to their individual physical and physiological characteristics.
From the background it is known that there are no differences in the number of possessions between winners and losers (Escalante et al., 2011, 2012; Saavedra et al., 2014), except in very unbalanced matches with a difference of more than 10 goals in the final score (Saavedra et al., 2014). Also, that the number of possessions per game period ranges between 10.3 and 10.8, which represents a total of 41.2 and 43.2 possessions per game, not counting those that require extra time. And that the time invested in each possession is in the range of 21.9 to 23.3 s. covering the situational frameworks of equality, counterattack and numerical inequality (Escalante et al., 2011, 2012; Saavedra et al., 2014). The influence of regulatory changes on the time it takes to score a goal has also been evidenced. Specifically, Madera et al. (2017) found that, with minimal exceptions, the time elapsed between goals was shorter as the duration of the period increased and the time of possession decreased in equal and unequal numbers. Given that previous studies have mainly used the winner-loser condition to discriminate against high-performing teams, and that they have focused mainly on the offensive phase of the game, this study is proposed with the aim of analyzing the frequencies and times of possession in the offensive and defensive phase as a function of the final classification achieved in top-level international championships.
Material and Methods
Participants
The participants were the men's national teams selected at seven European Championships (Zagreb-2010, Eindhoven-2012, Budapest-2014, Belgrade-2016, Barcelona-2018, Budapest-2020 and Split-2022) and eight World Championships (Shanghai-2011, Barcelona-2013, Kazan-2015, Budapest-2017, Gwangju-2019, Budapest-2022, Fukuoka-2023 and Doha-2024). For each championship, teams were selected and distributed into three groups according to their final ranking: Q1 (top three, medalists); Q2 (sixth, seventh and eighth place finishers); Q3 (bottom three).Thus, Q1 and Q3 represent the maximum and minimum level of performance in international championships, while Q2 identifies teams with a medium level. The choice of teams was made to balance the distribution of the sample so that performance was equidistant between the three levels of classification.Finally, the sample was drawn from 372 matches out of 641 (58%) played in all events, Q1 (n = 258; 34.7%), Q2 (n = 282; 37.9%) and Q3 (n = 204; 27.4%).
Procedure
The results of the independent variable (ranking in the championship) and dependent variables (attack and defense times and frequencies) in each period of play were retrieved from the official boxes scores on the Official Website of OMEGA Timing (http://www.omegatiming.com/) and the Official Website of MICROPLUS Data Processing and Timing (http://www.microplustiming.com/). There is no prohibition on the website from using the publicly accessible data found there for scientific purposes. These boxes scores provide information on the game time and the possessions.
In the first phase, both authors independently collected the match report data of 10 matches from other championships, different from the sample, and exported them to an Excel spreadsheet. Discrepancies in the extraction of the results were checked and discussed until the agreement was reached. Subsequently, the first author extracted the data from the two teams participating in each match in the sample over a period of two months. At the end, the second author repeated the data extraction for 37 randomly selected matches (10% of the sample). To assess the consistency of the measure, inter-observer reliability was tested through the Intraclass Correlation Index (ICC) using the two-factor mixed model. According to Martínez and Pérez (2023), the result was excellent (ICC = .93).
Statistics
A One-Way Repeated Measured ANOVA was performed to test the effect of the final ranking in the championship on the times and frequencies of attacking and defensive possessions. Four measures were taken in each match corresponding to the four periods of play. When the Mauchly test indicated that the variance-covariance matrix was spherical, the Assumed Sphericity was used. When the above assumption was not met, the epsilon corrective adjustments (Greenhouse-Geisser, Huynh-Feldt or Lower Bound) were used, whichever had the highest power. Subsequent intrasubject and intersubject comparisons were performed by comparing main effects and controlling the error rate with the Bonferroni correction. The significant level for statistical decision making was set at p< .05.
Results
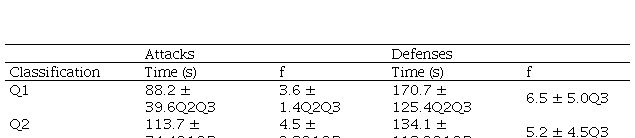
No significant differences were found in time per possession in attack (Table 1) between P1, P2, P3 and P4 (F2.924,2166.980 = 1.928: p = .125). In the comparison according to classification, significant differences were found in time in each attack possession (F2,741 = 7.557; p< .001; η² = .020; 1 – β = .945). However, a posteriori comparison only reached significant differences between Q1 and Q3. In the within-subject analysis, the interaction of period of play with classification did not influence time per possession in attack (F5.849, 2166.980 = 1.920; p = .076).
Time per Possession in Attack (s)
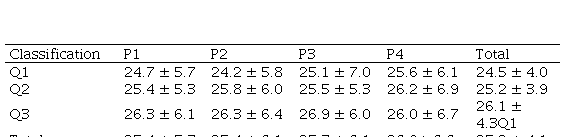
Note Q1Statistically significant differences from Q1
Accordingly, no significant differences were found in the frequency of attacks (Table 2) between P1, P2, P3 and P4 (F2.977, 2206.122 = 1.655: p = .175). In comparison according to championship classification, the frequency of attacks per period was similar between Q1, Q2 and Q3 (F2,741 = 2.983; p = 0.51). In the within-subject analysis, the interaction of period of play with classification influenced the frequency of attacks (F5.912, 2206.122 = 2.694; p = .013; η² = .007; 1 – β = .870). Specifically, Q1 had more ball possessions on P2 than on P3 and P4 (F3,739 = 5.510; p = .001; η² = .022; 1 – β = .941). For Q2 (F3,739 = 1.121; p = .340) and Q3 (F3,739 = .529; p = .662) the frequency of attacks was similar in all periods.
Frequency of Attacks
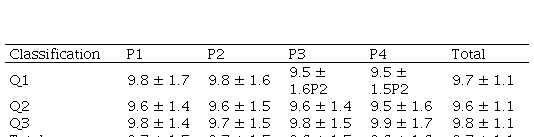
Note P2Significant differences with P2
No significant differences in time on defense (Table 3) were found between P1, P2, P3 and P4 (F2.930, 2170.856 = 1.795: p = .147). In the comparison by championship ranking, time on defense per period differed by classification (F2,741 = 63.979; p< .001; η² = .147; 1 – β = 1.0). Specifically, Q3spent less time on defense than Q2. No differences were found between Q1 and Q2 (p = .148). In the within-subject analysis, the interaction of period of play with classification did not influence the time without possession in defense (F5.859, 2170.856 = .602; p = .728).
Time on Defense (s)
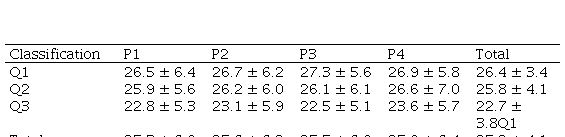
Note Q1Significant differences with Q1
Consequently, no significant differences were found in the frequency of defenses (Table 4) between P1, P2, P3 and P4 (F2.988, 2214.230 = 2.730; p = .099). In the comparison by championship classification, the frequency of defenses per period differed by classification (F2,743 = 38.555; p< .001; η² = .094; 1 – β = 1.0). Specifically, Q3 performed more defenses than Q2 and Q1. No differences were found between Q1 and Q2 (p = 1.0). In the within-subject analysis, the interaction of playing period with classification did not influence the frequency of defenses (F5.976, 2214.230 = .602; p = .728).
Frequency of Defenses
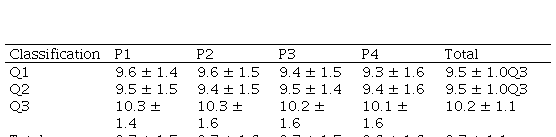
Note Q3Statistically significant differences with Q3
Time to goal (Table 5) also reached significant differences according to classification (Welch2,376.794 = 53.216; p< .001; η² = .179). Time to goal was lower the better the classification. Posteriori comparisons found differences between all classification levels (p< .001): Q1, Q2 and Q3. Consequently, the frequency of attacks to score a goal was significantly different according to classification (Welch2,372.280 = 49.002; p< .001; η² = .168). The frequency of attacks to score a goal was lower the better the rating. Ex-post comparisons found differences between all classification levels (p< .001): Q1, Q2 and Q3.
Time (s) and Frequency to Goal According to Classification
Note Q1;Q2;Q3Statistically significant differences with Q1, Q2 y Q3
On the other hand, time without possession to concede a goal (Table 5) was significantly different according to classification (Welch2,459.666 = 49.315; p< .001; η² = .100). Time to goal was greater the better the classification. A posteriori comparison found differences between Q3 with Q2 and Q1 (p< .001). Differences were also found between Q1 and Q2 (p = .002). Accordingly, the frequency of defenders to concede a goal was significantly different according to classification (Welch2,463.792 = 49.315; p< .001; η² = .079). The frequency of defenses was higher the better the classification. A posteriori comparison found differences between Q3 with Q2 and Q1 (p< .001).
Discussion
The purpose of this study was to analyze and compare the frequencies and possession times in offensive and defensive phases of the men's teams participating in 15 top-level international championships during the period 2010-2024 as a function of the classification achieved in the championship. Considering the results, the most important findings of this study were that the variables time of possession in attack and defence, as well as the frequency of possession in attack were influenced by the performance levels achieved by the teams as a function of their ranking in the championship. Likewise, the final ranking also influenced the frequencies and times of possession to score goals.
In the championships analyzed from 2010 to 2024 it was found that top international teams averaged 9.7 attacking possessions per game period with a duration of 25.7 sec. This data represents a total of 38.8 attacking possessions and a time of 16.6 min per game. Compared to championships prior to 2010 (Escalante et al., 2011, 2012; Saavedra et al., 2014), there were three to five fewer attacking possessions, but with a duration of two to four seconds longer. This difference could be due to the influence of regulatory changes (Madera et al., 2017). For example, the elimination of offside in the latest rule update (World Aquatics, 2022), whereby a player without the ball could not enter the 2-metre zone in front of the player with the ball, could lead to new, more dynamic attacking systems, in which wingers seek to break the defensive balance with longer, deeper and, consequently, more time-consuming movements (Madera et al., 2017).
In our study, the frequency of possessions in the offensive phase showed a similar result regardless of the classification in the championship. Similar results have been found when comparing this variable according to match winning and losing status (Escalante et al., 2011, 2012). The exception has been in matches that ended with a margin of more than 10 goals because of differences in the level of play between the teams (Saavedra et al., 2014). Although all participants had a similar frequency of attacking possessions, the time spent in the attacking phase per period of play was lower in the teams with the highest ranking, accentuating the difference between the medalists and the last ranked teams. If we also consider that the top-ranked teams needed fewer possessions and less time per possession to score a goal, we can deduce that they swam faster in both counterattacks and in the equalizer. In this regard, it is noteworthy that water polo players spend more than 20% of their time moving around the pool (Platanou, 2004b), and that swimming speed is a performance-determining variable whose physiological demand varies according to the specific position (D'Auria & Gabbett, 2008; Melchiorri et al., 2020). Not only that, but swimming speed distinguishes international and national level water polo players (Botonis et al., 2018). The fact that higher-performing players reach higher swimming speeds favors higher ranked teams to perform more counterattacks per match (Lupo et al., 2010). Since the duration of counterattacks is less than that of numerical equality or inequality, higher ranked players spend less time per possession in the overall match computation. Another plausible deduction for the efficiency demonstrated by the top-ranked teams would have to do with their greater competence in circulating the ball under parity, counter-attacking and numerical inequality. Passing the ball quickly through the different areas of the court in the offensive phase would force defenders to move continuously in order not to leave free spaces, not to concede advantageous throw positions or to block the throws that occur (Lupo et al., 2010). Consequently, the overexertion that the defensive balance would entail would be taken advantage of by the teams with better classification as they would find more favorable throw situations to score goals.
Regarding the results of the variables analyzed in the defensive phase, the most noteworthy was the higher number of possessions and the lower time per possession of the last ranked teams. These results were naturally correlated with the lower time of possession of the top ranked teams in the offensive phase. And, in line with what was analyzed above, they denote a poorer ability to retreat on the counterattack, to adjust the defensive balance in equal and unequal numbers, and to anticipate and intercept the pass or block the opponent's throws.
On the other hand, as in previous studies (García-Marín et al., 2015), the results showed that the dynamics of the game action remained stable throughout the four periods. Specifically, no differences were found in both the frequencies and times per possession in the offensive and defensive phases. And this behavior was confirmed for the three levels of classification in the championship, except for the higher number of possessions of the medalists in the second with respect to the third and fourth periods. From these findings, it can be interpreted that the top-ranked teams did not need to vary their playing style to achieve the desired performance, and that the lower-ranked teams were not able to do so. Therefore, it can be deduced that the competence to generate uncertainty in opponents was low, even though it is considered a key factor in team sports performance (Parlebàs, 2001). Moreover, from the point of view of water polo as a sporting spectacle, it is not positive that there is so much predictability of the result after the first periods of play, as it reduces the interest of spectators and sponsors (Stefani, 2015). Even more so, when many of the technical-tactical actions take place below the surface of the water, making it difficult to follow the game.
The limitations of the study include the impossibility of obtaining and analyzing the data for each situational framework independently. To date, the data that can be extracted from the records do not allow us to differentiate the frequencies and times of possession in equality, counterattack and numerical inequality, which considerably limits the transferability of the results to the field of water polo training. Therefore, in future studies it would be advisable to combine observational methodology with game-related statistics to increase the quality of the data and increase its applicability.Another limitation to note is the absence of regulation changes and winning the first sprint possession in each half as factors influencing the frequencies and timing of game possessions.
Conclusions
To conclude, the frequencies and possession times in the offensive and defensive phases were used as performance indicators in seven European and eight World Championships in the men's category between 2010 and 2014. In each 8-minute period of play, between 9 and 10 offensive and 10 defensive possessions with a duration of between 25 and 26 seconds were averaged. These values, together with the exercise intensities estimated in the Time Motion Analysis (D'Auria & Gabbett, 2008; Melchiorri et al., 2020; Platanou, 2004b) should be taken as a reference when planning specific training aimed at maximum performance in competition while respecting the natural alternation of the game between the offensive and defensive phases. Finally, the medalists were characterized by a shorter time of possession in attack, while the last classified by a higher number and a shorter time of possessions in defence.
Ethics Committee Statement
Not applicable due to the nature of the study, which did not involve human participants or sensitive data requiring ethical approval.
Conflict of Interest Statement
The authors declare that this research does not present any conflict of interest.
Funding
This research received no funding.
Authors' Contribution
Conceptualization FMAI&PGM; Methodology FMAI & PGM; Formal AnalysisPGM; Investigation FMAI & PGM; Resources FMAI.; Data Curation FMAI; Writing – Original Draft FMAI & PGM; Writing – Review & Editing FMAI & PGM; Visualization FMAI & PGM.; Supervision FMAI & PGM; All authors have read and agreed to the published version of the manuscript.’
Data Availability Statement
The data are available upon reasonable request from the corresponding author (pablo.garcia@usc.es)
References
Argudo-Iturriaga, F. M., García-Marín, P., Borges-Hernández, P. J., & Ruiz-Lara, E. (2021). Effect of rules changes on water polo shooting performance according to the final classification: High, medium, and worst level. Journal of Physical Education and Sport, 21(1), 188-200. http://riull.ull.es/xmlui/handle/915/34650
Argudo-Iturriaga, F. M., García-Marín, P., Borges-Hernández, P. J., & Ruiz-Lara, E. (2022). Shooting performance in high level women's water polo according to the final ranking. Journal of Physical Education and Sport, 22(6), 1487-1492. https://repositorio.uam.es/server/api/core/bitstreams/4b79ff52-9498-4107-ad55-ab2793c12299/content
Argudo-Iturriaga, F. M., García-Marín, P., Borges-Hernández, P. J., Sabio-Lago, Y., & Ruiz-Lara, E. (2021). Analysis of associated variables with shooting performance in Beach Water polo. International Journal of Performance Analysis in Sport, 21(6), 1117-1126. https://doi.org/10.1080/24748668.2021.1977559
Botonis, P. G., Toubekis, A. G., & Platanou, T. I. (2018). Evaluation of physical fitness in water polo players according to playing level and positional role. Sports, 6(4), 157. https://doi.org/10.3390/sports6040157
D'Auria, S., & Gabbett, T. (2008). A time-motion analysis of international women's water polo match play. International Journal of Sports Physiology and Performance, 3(3), 305-319. https://doi.org/10.1123/ijspp.3.3.305
Escalante, Y., Saavedra, J. M., Mansilla, M., & Tella, V. (2011). Discriminatory power of water polo game-related statistics at the 2008 Olympic Games. Journal of Sports Sciences, 29(3), 291–298. https://doi.org/10.1080/02640414.2010.532230
Escalante, Y., Saavedra, J. M., Tella, V., Mansilla, M., García-Hermoso, A., & Dominguez, A. M. (2012). Water Polo Game-Related Statistics in Women's International Championships: Differences and Discriminatory Power. Journal of Sports Science & Medicine, 11(3), 475–482.
García-Marín, P., Argudo-Iturriaga, F. M., & Alonso-Roque, J. I. (2015). The game action of the power play in water polo by periods. Retos: Nuevas Tendencias en Educación Física, Deportes y Recreación, 27, 14-18. https://doi.org/10.47197/retos.v0i27.34337
García-Marín, P., & Argudo-Iturriaga, F. M. (2017a). Water polo: Technical and tactical shot indicators between winners and losers according to the final score of the game. International Journal of Performance Analysis in Sport, 17(3), 334-349. https://doi.org/10.1080/24748668.2017.1339258
García-Marín, P., & Argudo-Iturriaga, F. M. (2017b). Water polo shot indicators according to the phase of the championship: Medalist versus non-medalist players. International Journal of Performance Analysis in Sport, 17(4), 642-655. https://doi.org/10.1080/24748668.2017.1382215
García-Ordóñez, E., & Touriño-González, C. (2021). Relationship between effectiveness and match outcome in the Spanish Water Polo League. Retos: Nuevas Tendencias en Educación Física, Deportes y Recreación, 41, 798-803. https://doi.org/10.47197/retos.v41i0.86353
García-Ordóñez, E., & Touriño-González, C. (2022a). Influence of contextual variables on indicators of offensive effectiveness in Spanish water polo. Cuadernos de Psicología del Deporte, 22(3), 179-196. https://doi.org/10.6018/cpd.487531
García-Ordóñez, E., & Touriño-González, C. (2022b). Key performance indicators of all-star players and winning teams in elite water polo at the 2020 Olympic Games. International Journal of Performance Analysis in Sport, 22(3), 317-331. https://doi.org/10.1080/24748668.2022.2061324
García-Ordóñez, E., Touriño-González, C., & Iglesias-Pérez, M. del C. (2017). Effects of situational variables on offensive performance indicators in elite water polo. International Journal of Performance Analysis in Sport, 17(1-2), 164-176. https://doi.org/10.1080/24748668.2017.1308112
Komić, J., Simović, S., Čaušević., D., Alexe, D. I., Wilk, M., Rani, B., &Alexé, C. I. (2024). The influence of game-related statistics on the final results in FIBA global and continental competitions. Applied Sciences, 14(12), 5357. https://doi.org/10.3390/app14125357
Lupo, C., Condello, G., Capranica, L., & Tessitore, A. (2014). Women′s water polo world championships:Technical and tactical aspects of winning and losing teams in close and unbalanced games. Journal of Strength and Conditioning Research, 28(1), 210-222. https://doi.org/10.1519/JSC.0b013e3182955d90
Lupo, C., Condello, G., & Tessitore, A. (2012). Notational analysis of elite men′s water polo related to specific margins of victory. Journal of Sports Science and Medicine, 11(3), 516-525. https://files.core.ac.uk/download/pdf/301904529.pdf
Lupo, C., Tessitore, A., Cortis, C., Minganti, C., &Capranica, L. (2010). Notational analysis of elite and sub-elite water polo matches. Journal of Strength and Conditioning Research, 24(1), 223-229. https://doi.org/10.1519/JSC.0b013e3181c27d36
Madera, J., Tella, V., & Saavedra, J. M. (2017). Effects of rule changes on game-related statistics in men’s water polo matches. Sports, 5(4), 84. https://doi.org/10.3390/sports5040084
Martínez, J. A., & Pérez, P. S. (2023). Intraclass correlation coefficient. Medicina de Familia. SEMERGEN, 49(3), 101907. https://doi.org/10.1016/j.semerg.2022.101907
Melchiorri, G., Viero, V., Tancredi, V., Bianco, R. D., & Bonifazi, M. (2020). Actual playing time of water polo players in relation to the field position. Journal of Human Kinetics, 73, 241-249. https://doi.org/10.2478/hukin-2019-0148
Ordóñez, E. G., Pérez, M. D., & González, C. T. (2016). Performance assessment in water polo using compositional data analysis. Journal of Human Kinetics, 54, 143-151. https://doi.org/10.1515/hukin-2016-0043
Özkol, M. Z., Turunç, S., & Dopsaj, M. (2013). Water polo shots notational analysis according to player positions. International Journal of Performance Analysis in Sport, 13(3), 734-749. https://doi.org/10.1080/24748668.2013.11868685
Parlebàs, P. (2001). Juegos, deporte y sociedad. Léxico de praxiologíamotriz. Editorial Paidotribo.
Platanou, T. (2004a). Analysis of the extra man offence in water polo: A comparison between winning and losing teams and players of different playing position. Journal of Human Movements Studies, 46, 205-211.
Platanou, T. (2004b). Time-motion analysis of international level water polo players. Journal of Human Movement Studies, 46(4), 319-332.
Sabio, Y., Cabedo, J., Guerra-Balic, M., & Argudo, F. M. (2020). Analysis of the shots in positions 1 and 2 in even situational framework during the World Championship of Barcelona 2013. Journal of Human Sport and Exercise, 15(2), 251-266. https://doi.org/10.14198/jhse.2020.152.02
Saavedra, J. M., Escalante, Y., Madera, J., Mansilla, M., & García-Hermoso, A. (2014). Comparison of game-related statistics in men´s international championships between winning and losing teams according to margin of victory. Collegium Anthropologicum, 38(3), 901-907.
Saavedra, M. J., Escalante, Y., Mansilla, M., Tella, V., Madera, J., & García-Hermoso, A. (2016). Water polo game-related statistics in women’s international championships as a function of final score differences. International Journal of Performance Analysis in Sport, 16(1), 276-289. https://doi.org/10.1080/24748668.2016.11868886
Saavedra, J. M., Pic, M., Lozano, D., Tella, V., & Madera, J. (2020). The predictive power of game-related statistics for the final result under the rule changes introduced in the men’s world water polo championship: a classification-tree approach. International Journal of Performance Analysis in Sport, 20(1), 31–41. https://doi.org/10.1080/24748668.2019.1699767
Stefani, R. (2015, 29 June – 1 July). The Relative competitive balance of male and female teams in world championship competition and the relative predictability of official international sports rating systems [Conference presentation abstract]. Fifth International Conference on Mathematics in Sport, Loughborough, United Kingdom. http://www.mathsportinternational.com/MathSport2015Proceedings.pdf
Tucher, G., de Souza, F. A., Martins de Quintais, S. D., Garrido, N., Gomes, R., & Silva, A. J. (2014). Relationship between origin of shot and occurrence of goals in competitive men′s water polo matches. Brazilian Journal of Kinanthropometry and Human Performance, 16(2), 136-143. https://doi.org/10.5007/1980-0037.2014v16n2p136
Vila, M. H., Abraldes, J. A., Alcaraz, P. E., Rodríguez, N., & Ferragut, C. (2011). Tactical and shooting variables that determine win or loss in top-level in water polo. International Journal of Performance Analysis in Sport, 11(3), 486-498. https://doi.org/10.1080/24748668.2011.11868567
World Aquatics (2022). Water polo rules 2022-2024. https://resources.fina.org/fina/document/2023/02/03/7935d035-dbdf-43f3-96b5-e40cb355dd84/221230-CLEAN-2022-2024_WP_Rules-Integration_diagrams-002-.pdf
Author notes
Autor para la correspondencia: Pablo García Marín, pablo.garcia@usc.es
Additional information
Título Abreviado: Frequencies and Times Possessions in Male Water Polo
How to cite this article: Argudo-Iturriaga, F. M., & García-Marín, P. (2025). Frequencies and times of possession in offensive and defensive phases according to classification in male high level water polo. Cultura, Ciencia y Deporte, 20(66), 2350. https://doi.org/10.12800/ccd.v20i66.2350


